Most of us would be aware of BMI (Body Mass Index) as a tool used to measure an individuals healthy weight range relative to their height and gender. We’ve been advised to monitor our BMI and are encouraged to keep it in the healthy range and don’t allow it to creep into the over weight or obese categories.
The problem with BMI is that the scientific evidence suggests that it is not an accurate predictor of a health when it comes to ageing.
Most studies indicate that having a higher BMI as we get older is linked to a lower mortality rate. That’s right. Higher BMI, live longer.135,136
What’s going on and is there a better indicator for health?
A recent study from Canada followed more than 50,000 middle-aged and older Canadians and found that body fat percentage is a better predictor of life expectancy than BMI. Being on the thin side or having a low BMI didn’t protect against early death. The results supported previous studies that show that mortality rates increased as BMI decreased and body fat percentage went up.137
The researchers reported that both low levels of lean mass and high levels of body fat are independently associated with increased risk of death, and concluded that a direct measure of body fat is really the most accurate way to determine health in ageing.
Does that mean that all these BMI studies are telling us that being fat is healthy?
The reason for this apparent contradiction is you don’t have to be “fat” to have a high BMI. For example if I put my height and weight figures into a BMI calculator (this one from the Australian Heart Foundation) it tells me I’m 1kg from being “overweight”, yet my body fat percentage is 12% (I range between 9-13% depending on my training goal). The more likely explanation is that many of the high-BMI participants of these studies may have low body fat and high lean mass and subsequently any measure of health should place them in a "healthy" range, not a high risk range for mortality!
So what is body fat and how do we measure it?
If you weigh 100kgs, and 10 kgs of that is fat, then your body fat percentage is 10%. 15kgs of fat would put it at 15%, 20kgs at 20%, you get the idea.
If you gain or lose only fat, your body fat percentage goes up or down accordingly. But it can also go up without gaining fat, and down without losing fat.
How is that possible? IT'S ALL ABOUT YOUR MUSCLE
Let’s say you’re fairly muscular and weigh 90kgs with about 12kgs of that being fat. That puts you around 13% body fat ((12/90) x 100). And if you were 185cm tall and male then your BMI would be 26 (Overweight range). If you stopped training (that is, lifting heavy weights) and lost 10kgs of muscle over the course of a year, without losing any fat, you now weigh 80kgs with the same 12kgs of fat. Your new body fat percentage is about 15% ((12/80) x 100) and your BMI (assuming you haven’t shrunk) is now 23 (Healthy range).
Of course we would all like to be going the other way, so let’s say you (the same 185cm male) weigh 85kgs and are carrying 10kgs of fat. Your body fat percentage is around 12% and your BMI is 24 (Healthy). If you gain 5kgs and little-to-no-fat, you’re now back to weighing 90kgs with the same 10kgs of fat, so your body fat percentage has now dropped to 11% but your BMI has gone back to 26 (Unhealthy).
It wouldn’t be one of my articles if I didn’t mention Age – Most calculations and images for determining body fat percentage assume ages of around 25-35 years old. The reality is that there will be higher body fat levels as your age increases. For example, a 20 year old man and a 50 year old man may have the same subcutaneous body fat measurement (fat under the skin), but the 20 year old may be 15% body fat and the 50 year old will be at 20%. Doesn’t sound fair, does it? As part of the ageing process, not only are we losing muscle (sarcopenia) but the fat around the organs (visceral) and within muscle (intramuscular) tends to increase.
While there is some debate as to what constitutes a “healthy” body fat range, there are some reasonable guidelines available.
Body Fat Percentage Chart
The chart below from the American Council on Exercise (ACE) is one of the most commonly used body fat charts.138 As you can see, women have a higher body fat percentage relative to men for a given level. Women have more fat because of physiological differences such as hormones, breasts, and sexual organs. In addition, women need a higher amount of body fat for ovulation.


Unless you’re a competitive bodybuilder and know exactly what you’re doing, I recommend you never try to reach the Essential Body Fat range. Organ failure can occur in this range, and it can only be maintained for a day or two. If you reach the athletic range, you’ll have a lean, ripped physique that the fitness enthusiasts like to achieve (this is where most six-packs kick in).
The limitation of this chart is that while it takes into account gender differences, it does not take into account your age, which is important for us over 40.
AccuFitness is the maker of the popular Accu-Measure Body Fat Caliper, which is a one-site skin-fold-body fat measurement method. When you buy the product, AccuFitness includes a body fat percentage chart based on research by Jackson & Pollock and because it utilises age based data (and I use the calliper), it’s the chart I prefer to use. (Full Chart here).139,140

So if you are a 45 year old woman, a body fat percentage of around 22.9% is considered ideal. (feeling better?)
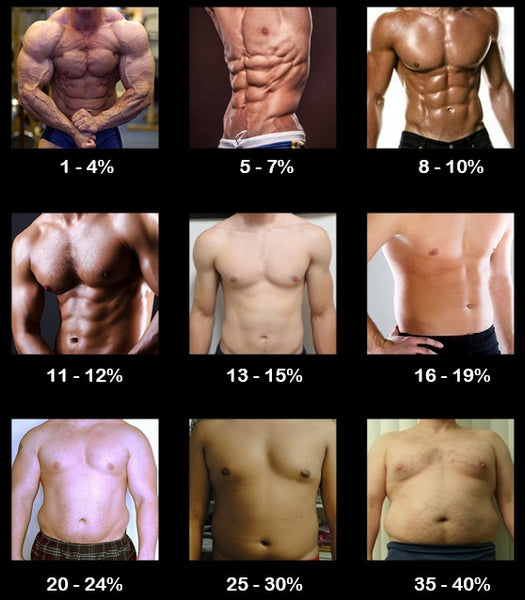
What will I look like?
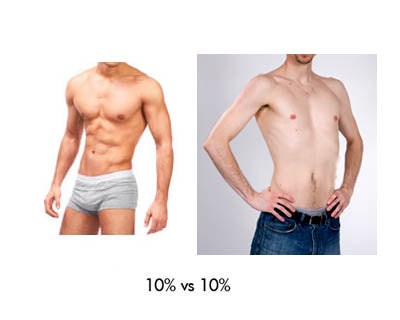
As you know, body fat percentage varies widely depending on how much muscle someone has.
10% body fat on a person with no muscle will look very different than 10% on a person with a lot of muscle, simply because the extra muscle fills out the physique and gives it some definition.
Here’s an example:
Despite the possible variations, the following images are accurate representations of various body fat percentages given the amount of muscle the men have.
As you’ll see, women look much leaner than men at higher body fat percentages. This is mainly because of the extra fat women naturally hold in their breasts, butt, and hips.

Most of these visuals are pretty accurate for the average woman, with the exception of the leanest categories (most women won’t have this much ab definition unless they’re veteran weightlifters).


0 comments:
Post a Comment